I am an unfortunate soul. Chicago sports fandom was bestowed upon me, as it was upon my father and my father’s father. While there is the occasional flare of success with a particular team (90s Bulls, 80s Bears, 2010s Blackhawks), the city as a whole seems doomed to mediocrity.
I began to wonder, is Chicago a worse sports town than others or am I just melodramatic? My investigation follows.
Best Sports Towns
Behold the historical win percentages of all sports places with at least 40 total seasons played. Green Bay is first, but that’s not really fair because Green Bay is not a sports town, it just has the Packers. Las Vegas is too new to truly count. Boston is really the first place on the list with a legitimate claim to being a “sports town.” Hover over Boston’s bar to see the numerous teams that have claimed Boston as their home, from the Boston Beaneaters to the Worcester Ruby Legs! To my surprise, Chicago is quite high on this list. There’s very little variation between places; most places are at or around .500.
Chicago in the Aggregate
The plot below shows the average winning percentage across all Chicago-area teams for a given season after 1920. While the White Stockings pulled off some great seasons in the late 1800s, Chicago as a sports town really began in the 1920s with the Bears, White Sox, and Cubs.
There were some good Chicago seasons between 1920 and 1940! Their winning percentage was mostly bolstered by the Bears, who somehow won almost every game. After 1940, the picture is less rosy. Of the 80 all-Chicago seasons since 1940, 36 have had a winning percentage over .500. Almost every season has seen a winning percentage between .400 and .600. 1991 was the best modern year for Chicago Sports. MJ’s Bulls and Ditka’s Bears buoyed the winning percentage as the Cubs and White Sox managed to not be horrible.
Chicago by Team
How has each team done? You can click on a team in the legend to show or hide their line. The Blackhawks have almost always been under .500, with the exception of the recent Kane/Toews teams. The Bulls were really good with MJ and Derrick Rose and the years in between were pretty bad, but its still a respectable franchise. The Cubs and the White Sox have both been pretty average (historical winning percetnages of .507 and .503 respectively). The Bears are by far the strongest team, with a historical winning percentage of .576.
When you break down the seasons by team, it looks like random noise. One team’s great season is cancelled out by another team’s poor season. You might be surprised that there aren’t sustained stretches where all the franchises in a given area are above average. I was too.
Chicago and Other Major Cities
Chicago is about consistent with the other major sports cities. None display sustained stretches above city-wide excellence.
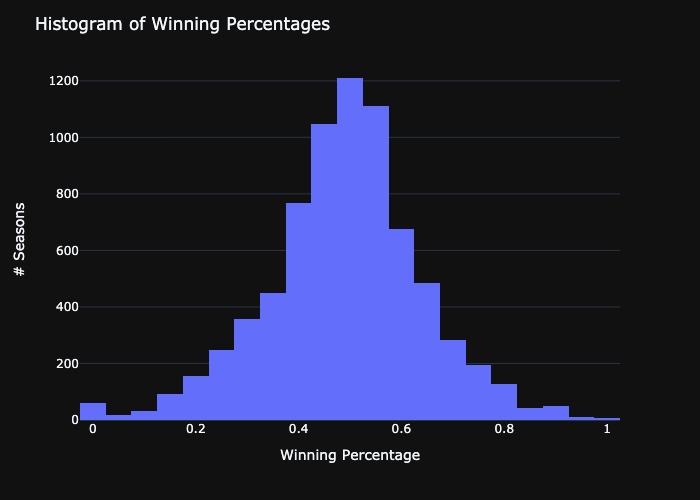
Seasons by Place
As with most things, winning percentage follows a normal distribution.1 The average win percentage is .488 and the standard deviation is .15.
For the below plot, I’ve restricted it to cities with at least three major sports teams during that season. Almost every season lies between .4 and .6, but the outliers are interesting. Place your cursor over a point to see the city and the teams. In 1998, for example, Atlanta managed a .72 winning percentage thanks to the contributions of the Hawks, Falcons, and Braves. On the other end of the spectrum, Philadelphia in 1972 managed a .25 winning percentage. They had 4 teams!
Top 10 City Seasons of All Time
| Year | City | Winning Pct. | Teams |
|---|---|---|---|
| 1927 | New York | 0.733563 | New York Giants: 0.889 New York Giants: 0.597 New York Yankees: 0.714 |
| 1998 | Atlanta | 0.71644 | Atlanta Falcons: 0.875 Atlanta Braves: 0.654 Atlanta Hawks: 0.62 |
| 1972 | Boston | 0.689898 | Boston Red Sox: 0.548 Boston Celtics: 0.829 Boston Bruins: 0.692 |
| 1937 | Chicago | 0.687446 | Chicago Bears: 0.9 Chicago White Sox: 0.558 Chicago Cubs: 0.603 |
| 1926 | Chicago | 0.687293 | Chicago Bears: 1.0 Chicago White Sox: 0.529 Chicago Cubs: 0.532 |
| 2007 | Dallas | 0.681585 | Dallas Cowboys: 0.813 Dallas Mavericks: 0.622 Dallas Stars: 0.609 |
| 2006 | Dallas | 0.675447 | Dallas Cowboys: 0.563 Dallas Mavericks: 0.817 Dallas Stars: 0.646 |
| 1966 | Philadelphia | 0.673346 | Philadelphia Eagles: 0.643 Philadelphia Phillies: 0.537 Philadelphia 76ers: 0.84 |
| 1929 | New York | 0.67224 | New York Giants: 0.889 New York Giants: 0.556 New York Yankees: 0.571 |
| 1930 | New York | 0.667594 | New York Yankees: 0.714 New York Giants: 0.833 New York Giants: 0.564 New York Yankees: 0.558 |
Bottom 10 City Seasons of All Time
| Year | City | Winning Pct. | Teams |
|---|---|---|---|
| 1971 | Buffalo | 0.215564 | Buffalo Bills: 0.071 Buffalo Braves: 0.268 Buffalo Sabres: 0.307 |
| 1972 | Philadelphia | 0.250135 | Philadelphia Eagles: 0.179 Philadelphia Phillies: 0.378 Philadelphia 76ers: 0.11 Philadelphia Flyers: 0.333 |
| 1939 | Philadelphia | 0.253285 | Philadelphia Eagles: 0.1 Philadelphia Athletics: 0.361 Philadelphia Phillies: 0.298 |
| 1940 | Philadelphia | 0.256149 | Philadelphia Eagles: 0.091 Philadelphia Athletics: 0.350 Philadelphia Phillies: 0.326 |
| 1936 | Philadelphia | 0.260018 | Philadelphia Eagles: 0.083 Philadelphia Athletics: 0.346 Philadelphia Phillies: 0.350 |
| 1972 | Buffalo | 0.260709 | Buffalo Bills: 0.321 Buffalo Braves: 0.256 Buffalo Sabres: 0.205 |
| 1942 | Philadelphia | 0.27243 | Philadelphia Eagles: 0.182 Philadelphia Athletics: 0.357 Philadelphia Phillies: 0.278 |
| 1979 | Detroit | 0.283863 | Detroit Lions: 0.125 Detroit Tigers: 0.527 Detroit Pistons: 0.195 Detroit Red Wings: 0.287 |
| 1969 | Pittsburgh | 0.292456 | Pittsburgh Steelers: 0.071 Pittsburgh Pirates: 0.543 Pittsburgh Penguins: 0.263 |
| 1941 | Philadelphia | 0.298268 | Philadelphia Eagles: 0.2 Philadelphia Athletics: 0.415 Philadelphia Phillies: 0.279 |
Conclusion
I didn’t find anything that interesting. Obviously winning percentage isn’t really the goal; cities want to take home championships. I’m unsure of how to factor in a championship into this analysis so I just ignore it. The accompanying code can be found here.
-
This is an example of the Central Limit Theorem. We’re summing up individual sports teams (independent random variables) and we get a nice normal distribution. ↩