TLDR: I run an elevator simulation to determine optimal behavior in my apartment building when an elevator breaks.
The Problem
My apartment building has three elevators, but one is reserved for freight. So, it really has two elevators. Usually, you press a button and one of the elevators comes to pick you up.
But one of the elevators broke down! So, there was only one elevator to service a 23-story apartment building. Alas, the management, opened the freight elevator to the residents to increase throughput. The freight elevator has its own button, which works independently of the passenger elevator. In other words, if you press both the regular elevator and the freight elevator button, both elevators will come to get you.
I noticed one day as I was descending that the elevator kept stopping for no passengers. I realized the people in my building had started pressing both buttons and then getting in the elevator that arrived first!
This was irritating to me, because I was already running late and it was as if a little kid had pressed every button in the elevator (except it was self-interested adults who did it). That got me thinking. Is this behavior optimal? Pareto optimal? Is the average elevator time slower if everyone pushes both buttons?
My first attempt at solving this is to run a simulation in Python. I’ve shown pieces of the code below, but the entire Jupyter notebook can be found at my github.
Simplifying Assumptions
- Elevator going down picks up people that want to be picked up (regardless of when they push button)
- If someone gets on at a non lobby floor, they’re going to the lobby
- Elevator drops off passengers on its way up and on the way down at the lobby
- Half of the customers come on at the lobby, the other half come on with equal likelihood on the residential floors
- When an elevator stops, it stops for 5 seconds (initial parameter)
- An elevator travels one floor per second (initial parameter)
- Rate of elevator use is constant (this is kind-of true for peak times)
Creating the Simulation
This section explains how I set up the simulation. If you are not interested in the methods, code, etc., feel free to skip to Results.
Elevator Class
We’re going to have multiple elevators, which all do the same thing. Good time to make a class! I’ve shown the move function for an elevator. The main point is an elevator can be in the following states, which are in the same order in the if-elif-else loop:
- idle: the elevator does not have anyone inside and does not have anyone to pick up.
- stopped: elevator has stopped to pick up / drop off people. You have to wait a few seconds to keep going.
- stopping: elevator should stop at current floor to pick people up or drop off
- moving: elevator is moving either up or down
class Elevator(object):
    def move(self, time):
        self.time = time
        if self.idle:
            return
        elif self.stopped > 0:
            # if stopped, stay stopped
            # can pick up more customers too
            self.stopped -= 1
            self.pick_up()
            self.drop_off()
        elif self.should_stop():
            self.pick_up_and_drop_off()
        else:
            self.loc += 1 if self.moving_up else -1
Customer Class
The customer class does not have much logic. The key is to randomly generate current floor and destination floor.
class Customer(object):
    def __init__(self, start_time, cust_number, n_floors=23, percent_lobby=.5):
        rand = np.random.random()
        randint = np.random.randint(3, n_floors+1)

	    # half the time, someone gets on at the lobby, other half someone gets on a random floor
        self.curr, self.dest = (0, np.random.randint(3,23)) if rand <= percent_lobby else (np.random.randint(3,23), 0)
        self.start_time = start_time
        self.on_elevator = None # which elevator customer entered
Parameters and Simulation Setup
The simulation is simply a for loop. Each iteration corresponds to a second. This is a convenient way to avoid synchronization and object-object communication.
Simulating Arrivals
I am sampling a poisson distribution to determine arrival time. The lambda in this case is the number of seconds it takes for a passenger to call the elevator. I then take the cumulitive sum of this sample, and this gives the times at which a passenger arrives.
Poisson Distribution Assumptions
One important poisson assumption is that lambda is constant. Of course, it’s not in my hotel. But for the purpose of this, I’m going to assume there’s one hour that’s relatively busy where a person calls an elevator every 20 seconds.
def simulation(button_press_func=None, time_steps=3600, wait_time=5, poisson_lambda=20, n_floors=23, debug=False,
              percent_lobby=.5):
    cust_number = 0
    arrivals = np.random.poisson(lam=poisson_lambda, size=10000).cumsum()
    e1 = Elevator('Service Elevator')
    e2 = Elevator('Regular Elevator')
    for i in range(time_steps):
        if debug:
            print(f'time step {i}')
            print(plot_hotel(e1, e2, n_floors))
        e1.move(i)
        e2.move(i)
        if i in arrivals:
            cust_number += 1
            temp = Customer(i, cust_number, n_floors=n_floors, percent_lobby=percent_lobby)
            button_press_func(temp, e1, e2)
    return e1, e2
Decision Function for Customer (Both Buttons or One Button)
Our simulation takes a function to decide which elevator the customer gets on. Below defines the simulation in which every passenger presses both buttons.
def press_both(temp, e1, e2):
    e1.new_customer(temp)
    e2.new_customer(temp)

press_both_sim = simulation(button_press_func=press_both, debug=False, time_steps=3600)
Output Example
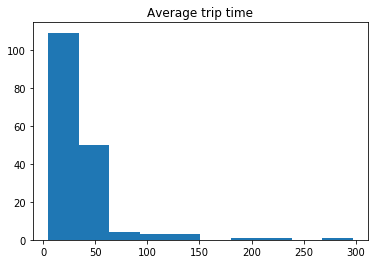
To analyze results, I’ll be outputting a histogram of the time spent in route (waiting for and riding the elevator). I’ll also output a few statistics of interest, like throughput, average time, and worst case time.
display_results(*press_both_sim)
Service Elevator throughput: 86
Service Elevator mean elevator time: 35.33720930232558
Regular Elevator throughput: 86
Regular Elevator mean elevator time: 38.58139534883721
combined mean elevator time: 36.9593023255814
Worst trip time was 297
Results
Comparing Average Times Based on Button Pressing
Lets compare different behaviors. Is double pressing worse than single pressing?
def press_one(temp, e1, e2):
    if np.random.randint(2):
        e1.new_customer(temp)
    else:
        e2.new_customer(temp)

press_one_sim = simulation(button_press_func=press_one, debug=False)
display_results(*press_one_sim)
Service Elevator throughput: 92
Service Elevator mean elevator time: 35.95652173913044
Regular Elevator throughput: 83
Regular Elevator mean elevator time: 41.734939759036145
combined mean elevator time: 38.69714285714286
Worst trip time was 174
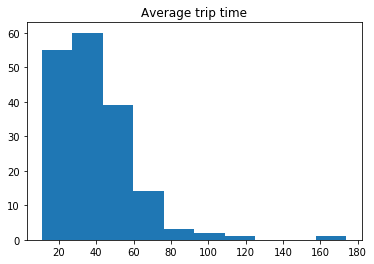
Look at the average results. If everyone presses both buttons, we get about 37 seconds of average travel time. If everyone presses one button, we get about 39 seconds of average travel time. I’m not too confident about these results because this is only one trial. We’ll be more rigorous later.
Looking more closely at the histogram reveals an interesting result. The tail if everyone presses both buttons is longer. This means, everyone does a bit better on average, but the worst case is worse. The worst case if everyone pressed both buttons is about two minutes longer! Yea, on average we go slightly faster (2 seconds) but we can potentially have a much longer ride.
This is a good example of mean being a misleading statistic if the distribution is not Gaussian (not a normal curve). We have these long tails, which are hidden if we focus only on the mean. We should focus on the median, which is resistant to outliers! The worst case is also useful to some extent, but not the end all, be all. It would be wise to look at quantiles.
Comparing Median and Quantiles
Now I will look at median and quantiles when comparing the two distributions.
def summary_statistics(oen_times, two_times):
    print(f'Median for pressing one button: {np.median(one_times)}')
    print(f'Median for pressing both buttons: {np.median(two_times)}')
	xs, one_ys, two_ys = [], [], []
    for i in range(1, 100):
        quant = .01*i
        xs.append(i)
        one_ys.append(np.quantile(one_times, quant))
        two_ys.append(np.quantile(two_times, quant))

    plt.plot(xs, one_ys, label='One Button')
    plt.plot(xs, two_ys, label='Both Buttons')
    plt.legend()
    plt.xlabel('Quantile')
    plt.ylabel('Time')
summary_statistics(one_times, both_times)
Median for pressing one button: 34.0
Median for pressing both buttons: 28.0
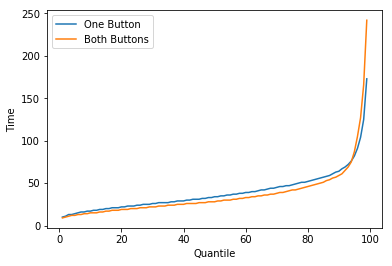
Here is an interesting result. Around the 95th quantile, pressing both buttons significantly increases elevator time. However, in general it is faster. So, 5% of the time, you are going to get unlucky and have a worse time.
So, if everyone chooses to press both buttons, we get a 6 second speed up, at the expense of a 2 minute worse, worst case scenario.
Conclusions and Future Work
I was really hoping that the simulation would prove my intuition right. I was angry at the two-button-pressers and wanted to score a victory for the less wasteful one-button-pressers. This did not turn out to be true.
I explored ratios of different pressers hoping to find an optimal ratio of people pressing both buttons, but the variation was simply too high.
This is a very basic exploration of this complicated problem. I did not explore how different parameters, which are not that accurate, would affect the outcome.
In the future, I hope to explore the following:
- What happens to the people who are one button pushers? (I personally feel guilty wasting an elevator trip, so I only push one.) In general, what happens when its not everyone doing the behavior, but some combination of the two.
- How does the result change if we vary elevator speed, time it takes to open and close, arrival speed, etc.
- How can we model this analytically, i.e. without a simulation?