The NFL just had its annual draft. My team, the Chicago Bears, had the first overall pick and traded down. The Chicago Blackhawks also recently won the lottery for the first NHL draft pick with considerable excitement about potential generational talent Connor Bedard. The Chicago Bulls lottery pick fell outside of the top four and their pick thus went to the Orlando Magic. For all the excitement, how big of a difference does this all make? How reliably does having a higher draft pick translate to drafting a better player?
Key Findings
My findings aren’t particular surprising. Briefly:
- Earlier picks are reliably more valuable. In the NBA, much of the value in a draft comes in the first 10 picks. In the NHL, it’s mostly within the first 5 picks. The NFL is more evenly distributed across the entire first two rounds, but there is a clear premium with the first 20 picks. Value for MLB is much less biased towards the beginning of the draft, but there is still a premium with the top few picks.
- When segmenting by position, the top pick is considerably more valuable. After the first few picks for a given position, it is less clear that any pick is more valuable than another. Certain positions (like QB) have higher premiums for the first selected.
- Around 60-80% of the draft value is captured in the first 20% of the draft. Tom Brady picks are few and far between.
- There is not much evidence for improvement in draft efficiency over time. The NFL shows some evidence at improvement.
Approach
The difficult thing here is to standardize across sports. How do you measure an effective player in the NBA, MLB, NHL, and NFL? Each sport has its own “statheads”, who develop increasingly convoluted statistics that communicate player value. My outcome I am choosing to study is “# of seasons where player is All-League.” The All-NBA, All-Pro (NFL), and All-Star (NHL) designations are chosen not by popularity but by a poll of coaches and media experts. For MLB, because they only recently started selecting “All-League” teams, I am using “# of seasons with WAR > 4” as my metric for effective seasons.
| League | Outcome | Data Date Range |
|---|---|---|
| NBA | # All-NBA Seasons | 1947 – Present |
| NFL | # All-Pro Seasons | 1970 – 2016 |
| MLB | # WAR > 4 Seasons | 1965 – 2019 |
| NHL | # All-Star Seasons | 1963 – 2022 |
There are a number of criticisms I anticipate with these metrics, which I will respond to in-line:
- Different positions have different value. An average QB is going to contribute more to winning than an All-Pro offensive lineman. I stratify by position to hopefully address this.
- All-league seasons may be less important than consistency. For example, a PG who plays 15 seasons pretty well may be a better pick than a PG who has one great season and gets injured and is never the same (cough, Derrick Rose). True, I don’t have much to say about this other than your first round pick you want to be great, not just consistently good. This analysis is heavily bias towards early draft picks
- This metric is sparse: only a few people each year get recognized. A lot of valuable players will be zeroes and look no different from total busts. True, but it’s my assumption that with your first round pick you want to hit the jackpot. Additionally, most of my analysis relies on ordinality within a given draft year. So, as long as the better player’s outcome is greater than or equal to the worse player’s outcome, I think it’s ok. Also, maybe I’ll re-run the analysis with more continuous player value statistics.
I look at a few other metrics derived from my “outcome”, such as forgone value. Foregone value is defined as the difference between the most valuable available pick at position $i$ in the draft and the actual pick
\[f_i = \max_{j \in i+1..N}\{O_j\} - O_i\]So, if you take the best player, your foregone value is 0. However, if you drafted Sam Bowie instead of Michael Jordan, your foregone value is equal to the number of All-NBA teams Michael Jordan made. We can sum these foregone values to determine a “badness” for a given draft. If there was a great player picked late, this is going to heavily skew the foregone value in the draft.
I will also consider value share, which defines the percent of the total draft value that came from a given pick. For example, in a draft where the players achieve a total of 30 all-league teams, and the player you drafted had 15, that draft pick had a 50% value share.
\[VS_i = \frac{O_i}{\sum_{j} O_j}\]Is the Earlier Pick More Valuable?
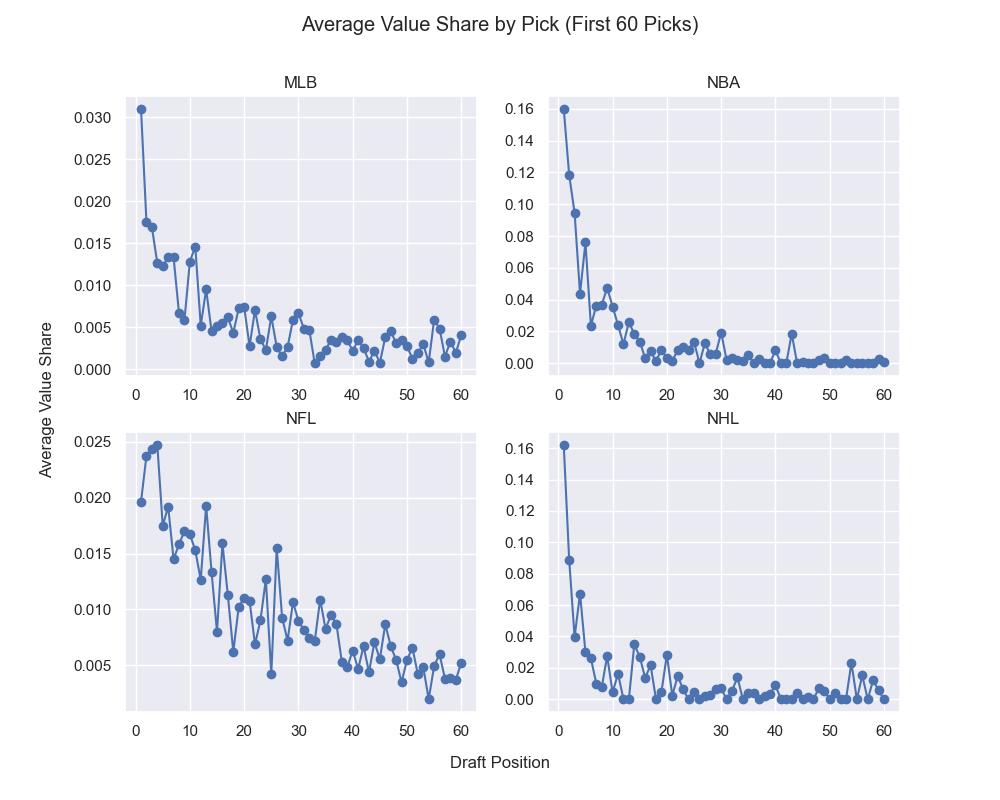
So to answer my original question, how big of a deal is the first pick? It’s a pretty big deal. If you look at the below graph, which shows average value share by pick for the first 60 draft picks of the sports I’m examining. For the MLB, NBA and NHL, the first pick has substantially higher “value share”, each hovering around 30%. The drop off is precipitous as well; in these leagues, you have a much lower return with the 2nd pick. The NFL tells a different story, curiously enough. The first pick has a lower average value share than picks two through four.
Is the Earlier Pick More Valuable by Position?
So, maybe the first overall pick in the NFL isn’t that valuable. But this is an artifact of the fact that the #1 pick is usually a QB (22 of 46 draft years in my dataset), and it’s hard to have an All-Pro QB because there are only two each season. This is where the more granular (and dubious) player value statistics would come in handy. What I really want to see is, by position, is the more valuable player drafted earlier. So, if you take a QB first overall, is he more valuable than the next QB off the board?1
The answer is yes. The interactive plot below shows average value share by pick for various positional groups. In general, the earlier pick, the higher average value share. This is especially true among the first 2 or 3 positional picks in the NFL and the first 2 picks among centers in the NHL. The NHL result is fairly intuitive. The most valuable position is probably center, and that’s what the generational talents play. Prominent first overall center picks include Ovechkin, Crosby, Taveras, McDavid, Matthews, Stamkos, all of whom boast multiple All-Star team appearances.
The MLB is flatter than the other leagues, suggesting there is less draft efficiency; the first overall pitcher is barely more valuable on average than the second, third, or fourth. There are also less obvious returns to the first pick among NFL wider receivers and defensive backs.
One limitation of this analysis is the all-league accolades allot two awards by position. For simplicity (and because offensive lineman are fungible to an extent), I have grouped certain positions together. For example, all NFL offensive lineman (5 positions) are labeled “OL.” There are 10 All-Pro slots each year, versus two for “QB.” Imagine this year’s All-Pro team is made up exclusively of player’s from this year’s draft class. Each All-Pro QB will have a value share of .5 while each All-Pro OL will have a value share of .1. This is all to say don’t pay too much attention to the actual numbers, instead look at the slope.
The next graphic shows the average overall pick for each positional pick. This graph is again heavily biased based on the number of players you need at a given position. Still, it might be interesting for you to view when various positions are drafted.
Quantifying a Draft’s Potential and Efficiency
Let’s start by a simple draft potential reference. Some drafts are famously loaded, like the Jordan draft or Lebron draft. Other drafts are… less loaded, like when Anthony Bennett went first overall in 2013. A simple way to evaluate a draft’s potential is to sum up the accolades. Below, I present a plot for each sport. It shows normalized draft potential, where 1 is the draft with the most all-league appearances and 0 means there are no all-league appearances by any members. You can mouse over each data point to find the valuable players from each draft.
Naturally, these graphs look like random noise. The downward slope towards more recent years simply reflects that the players taken in those drafts have not had as many accolades because their careers haven’t played out yet. The NFL chart looks like there’s a negative slope, which could result from changes to the All-Pro teams. I don’t think it is the result of a meaningful increase in exceptional undrafted players.
We can look at a draft’s efficiency by comparing how quickly the valuable players are drafted. The chart below shows how quickly a sport “accumulates” the value in a draft. We see something of a Pareto distribution: all sports have 60% or greater of their value drafted in the first 20% of the draft. Very little value is eked out in the last 60% of draft picks.
Have Drafts Become More Efficient Over Time?
I didn’t find much evidence for more efficient drafts. There are still plenty of “sleepers,” despite increased surveillance and sabremetrics.
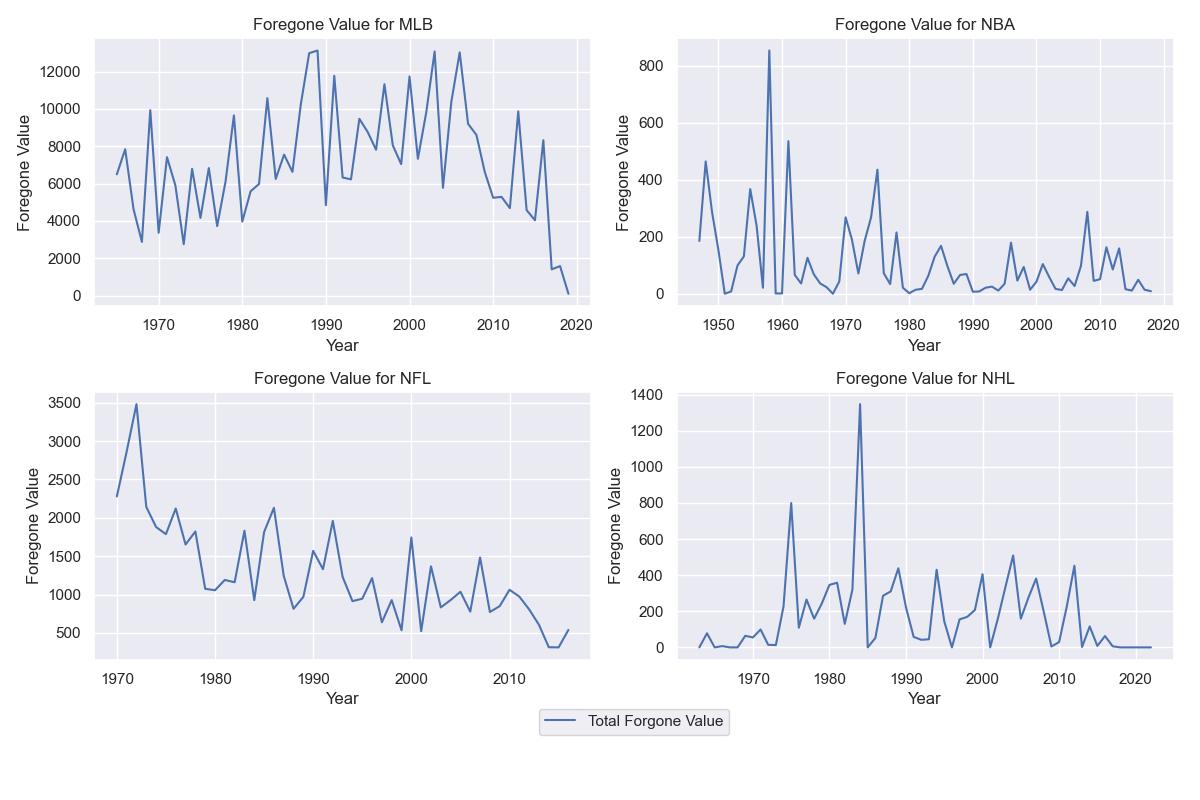
If we look at the foregone values sums by draft year over time, this provides some evidence that the NFL has gotten better over time. MLB appears to have gotten worse, and NBA/NHL have always been pretty spot on.
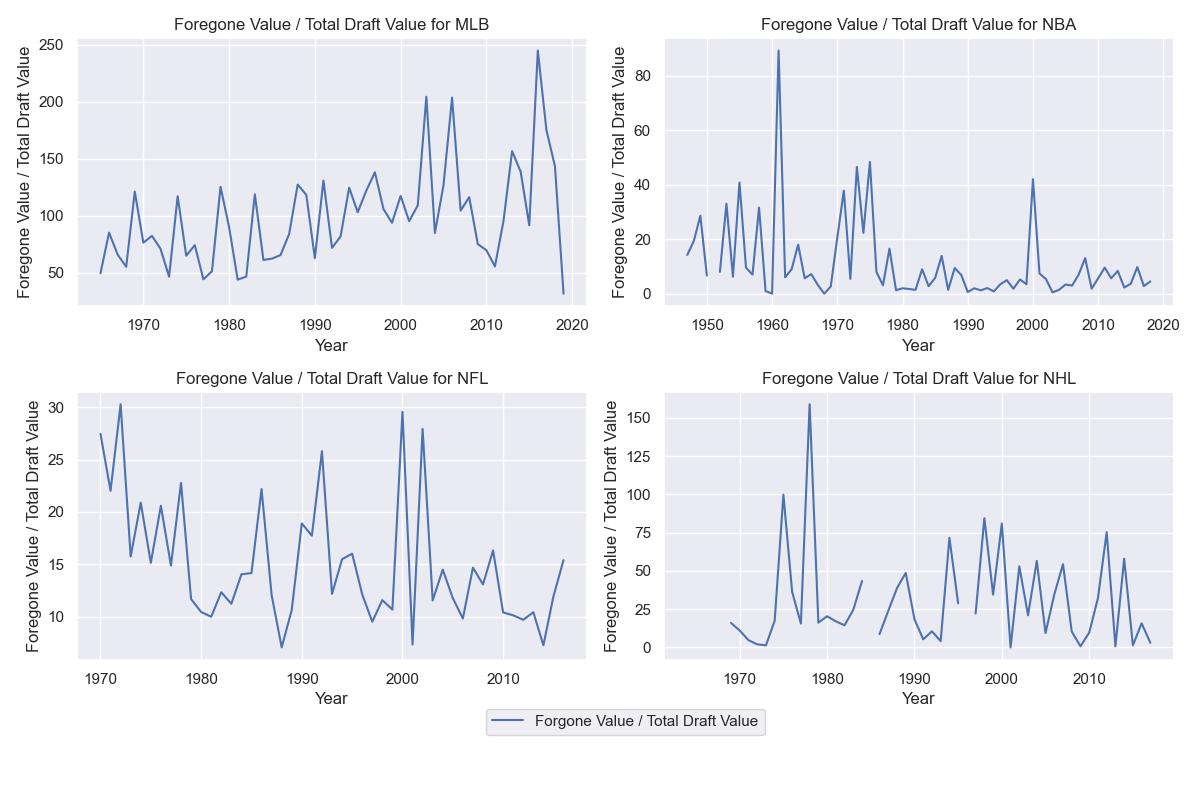
The below graph shows the foregone value relative to the total value available in the draft. This plot shows that foregone value doesn’t appear to be decreasing if we take into account how much potential value there is in a draft. If anything, it looks like the MLB has gotten worse and the other sports appear to be random noise over time.
Is Drafting Easier in Some Sports?
MLB appears to have the most difficult draft. First round picks will often produce no substantial value for a team. The NBA and the NHL have it easiest. Much of this can be explained by the substantial minor league journey a player must go through in the MLB. For some reason, baseball players take a long time to transition from amateur leagues to pros, and there is significant unpredictability in this transition. Consider the other sports leagues, where high draft picks often immediately go into starting roles. The products in the draft are much more polished by comparison.
Conclusion and Limitations
There’s a lot of analysis to be done, but I think this framework is nice because it works independently of the defined outcome. Do you want to use weird statistics? Be my guest.
This analysis comes with a lot of limitations. In particular, I do not account for undrafted players. For the positional analysis, positions are lumped into broad categories, and I have no way to account for relative positional value for the sport. I simply try to answer the question of “do earlier draft picks produce more value,” the answer to which is yes for the early draft picks and not really for later draft picks.
Additionally, the dataset I use isn’t that great. I didn’t have the appetite to do a data scraping project, so I used convenient sources and, as a result, I am missing information and statistics (like NBA position values!)
Appendix
This is the first project where I’ve relied heavily on ChatGPT. I found the programming very useful for iterating. It was somewhat useful for data manipulation (although I’m pretty skilled at this so it was usually faster for me to just do it myself). For visualizations, it was very helpful. I kept asking, given a dataset, how do I make this plot? With this working model, I was able to easily make adjustments and then copy the new answers ChatGPT outputted. Despite never using Plotly Dash before, I was able to create a Dash WebApp in a few minutes. That was nice. I’ll have to try the same with D3-js.
I tried to get analytical help, along the lines of “how else can I evaluate a draft efficiency?” It kept suggesting answers that were infeasible given my dataset. This wasn’t very helpful, but reading other peoples’ analyses was, so go humans.
I discovered something cool thanks to ChatGPT. Let’s say you’re trying to process some file and you get an encoding error (like in the MLB WAR dataset for special characters in some players’ names.) The python package chardet will tell you what encoding is being used so you don’t have to mess around trying to find out (see below). I recommend.
import chardet
with open('./path/to/your/file', 'rb') as f:
result = chardet.detect(f.read())
print(result)
-
I am not including NBA player-level statistics because I couldn’t find a draft dataset that included player position. And I didn’t want to go through the trouble of scraping my own draft dataset, although I may in the future. ↩